
Ops and Field apps
Every layer for every paddock, in the office and in the ute
Survey layers, soil tests, satellite, yield, protein, drone scans and prescriptions, filed by grower, farm, paddock and season. Cropix Ops is the web app for the office; Cropix Field puts the same data on your phone or iPad.
every clear imageDaily
On this page
On this page
Cropix Ops
The web app at app.cropixsa.com.au. Every layer in this site lives there, from the first survey to this year's harvest, grouped by type: yield, protein, soil survey, derivatives, topography, satellite, predictions and prescriptions.

Map and layers
Every layer for every paddock, with histograms and statistics for each.
Soils
Every sample on the map, rated against critical values, with a paddock summary.
Satellite
Sentinel-2 imagery, long-term NDVI, biomass percentiles and NDVI stability.
Soil Planner
Targeted sampling plans built from the survey layers.
Regression
The prediction engine: from soil tests to full-paddock maps.
VRA builder
Prescriptions for fertiliser, seed, lime, ameliorants and spray.
Reports
Branded PowerPoint reports with maps, KPI bars, soil heatmaps and data tables.
Drone Scans
Weed detections and drone prescription maps, with density heatmaps.
Import and Data Edit
Data from any machine or lab, cleaned and logged.
Scouting
Drop pins or draw areas from the office or the paddock.
3D Viewer
Any layer draped over the terrain.
Ag Data Studio
Screen data from John Deere, Trimble and ISOXML displays.

Cropix Field
The mobile app, with the same login and the same data as Cropix Ops. Anything loaded in Ops is on your phone straight away. It installs from the browser, with no app store, on iPhone, iPad and Android. Pins and areas added in the paddock show up in Ops, and Ask Cropix is built in.


Yield and protein
We collect yield and protein data from your headers each harvest, clean it and map it in Cropix. Each season is stored, so maps can be compared and combined across years. Yield files come from all the major displays, protein from CropScan and other NIR sensors, and soil results straight from the lab.


Data cleaning
Raw header data carries errors: overlapping passes, the header filling and emptying at the ends of runs, sensor spikes, and calibration differences between machines. Yield and protein files are cleaned in Cropix Data Edit before they're mapped, and every step is logged so you can see what was removed and why.


The steps
- Overlap removal: points closer than 2 m, the later pass wins
- Pass-end clip: trims the fill-up and run-out at each end of a run
- Min/max filter: drops impossible or zero yields
- Outliers by machine: ±3 standard deviations, per header
- Machine calibration: matches headers to each other on the same paddock
- Duplicate removal, a 0.1% percentile clip at each end, and a local outlier filter for readings that don't fit their neighbours within 25 m
Yield Centre and yield zones
Every harvested paddock ranked by yield, tonnes and protein, with yield zones, protein against yield and a reading of any spot on the map. Stacking every harvest map shows which parts of a paddock are reliably strong, reliably weak, or swing from year to year, and those zones become the base for prescriptions, soil-test placement and trial design.


Crop Watch
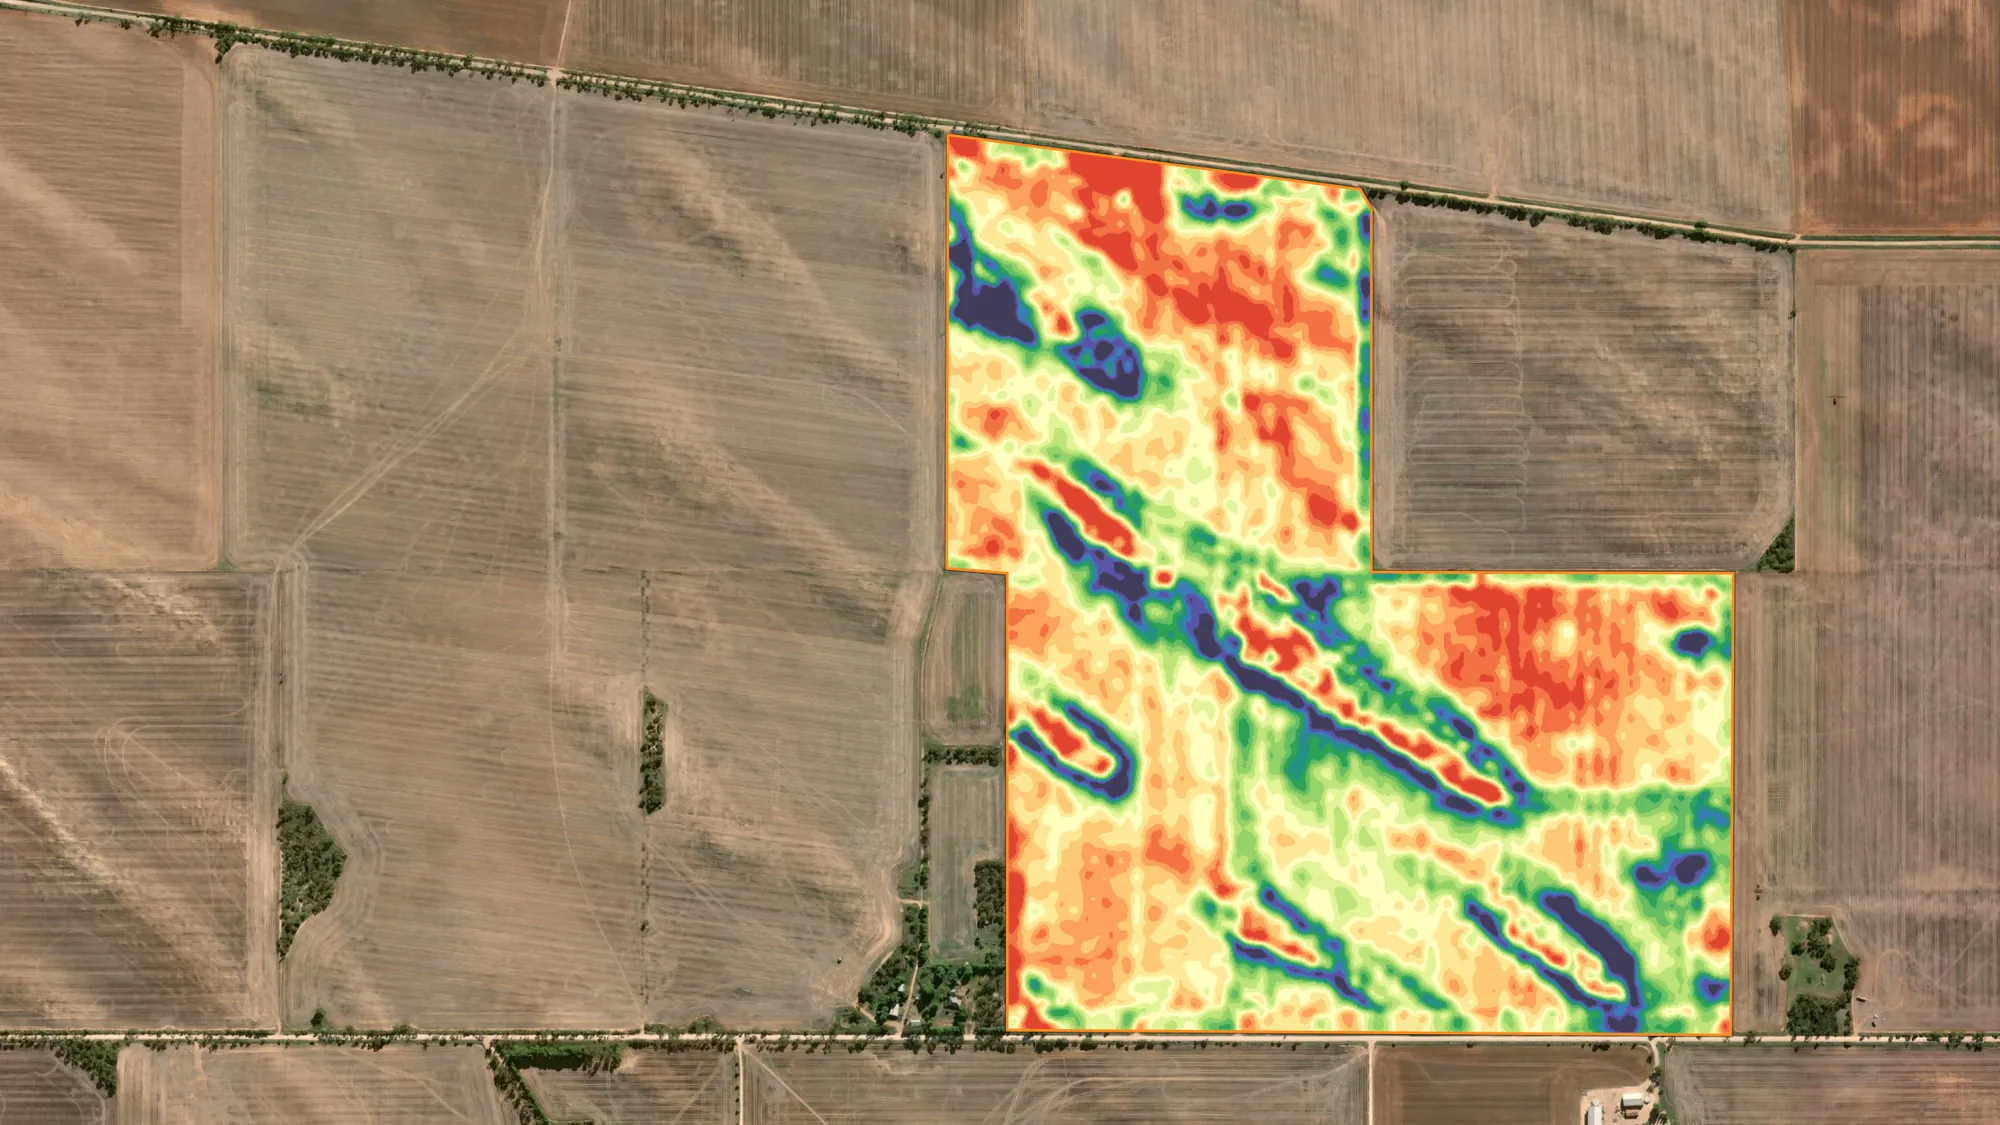
Every clear satellite image is checked each morning. A patch that changed far more than the rest of the paddock is flagged, and each paddock's NDVI is tracked against its own normal through the season.

Yield Centre, yield zones, stability maps and Crop Watch are in every subscription. Alert notifications are part of Premium.
Premium
Yield Predictor, margin and nitrogen
The Premium tier adds the Cropix analytics suite: yield and margin forecasts, in-season alerts, nitrogen use, profit mapping and a full end-of-season report for each paddock. See the tiers.


Inputs
Products applied, from machine files and every prescription made in Cropix. Where as-applied data exists, each pixel is charged for the product it actually received.
Nitrogen use
2025 barley removed 121 kg N/ha in grain. With an example 69 kg N/ha applied, it drew about 52 kg N/ha from the soil. Every season is listed, with NUE where a soil N test is in place.
Coming to Premium
Regional benchmarking of NUE, yield and stability.
Relationships and Layer Builder
Relationships ranks every survey, derivative and predicted layer against a season's yield, NDVI or any other layer, so you can see what is driving the pattern. Layer Builder makes new layers from the survey: ready-made derivatives, a phosphorus response potential map, or your own weighted blend.


Strip and block trials on your own paddocks
Trials are designed in Cropix Ops on the paddock's own run lines, loaded into your controller as rate files, and measured with your yield and protein maps. Strip and variable-rate trials are included in every subscription.

- Design
Long strips, replicated blocks, factorial or free-form plots, laid out on the paddock's AB line or fence. Plot width is set in machine passes.
- Set up
One rate file per product for your controller. The layout locks when the files go out.
- Monitor
Satellite or drone NDVI on every plot, plus hand scores such as disease %.
- Measure
Yield and protein for every plot, with headlands, the controller's ramp and the header's flow delay left out. Results show which differences are real and where the economic optimum sits.
Running trials for a chemical, seed or fertiliser company? See technical trial services.
Ask Cropix
Questions about your data, in plain English. Ask Cropix answers from your own yield and protein maps, soil tests, survey layers, prediction models, NDVI and weather. It lists the data it used, can open pages and show layers, and is in Cropix Field too.

Field setup and machine data
We set up displays and controllers, build RTK run lines and boundaries, and collect the data your machines record, whichever brand they are.
Setup
- Displays and controllers set up across New Holland, Case IH and John Deere
- RTK run lines and boundaries built and managed for every paddock
- RTK boundary mapping with a ute-based survey, where boundaries need redoing
Machine data
- Screen data from John Deere Gen 4 and GS3 2630, Trimble, and ISOXML from Fendt, Topcon, CNH and Ag Leader
- Seeding as-applied data collected and stored with every paddock
- Boundaries, crop plans, soil tests, yield, protein, as-applied and survey data uploaded from any machine or lab